Physical Sensors
What are physical sensors?
Sarah Hicks | Kent State University
Physical sensors are commonly used in the study of lakes and other freshwater resources. They are different from chemical or biological sensors in that they measure parameters such as temperature that regulate the transfer or flux of mass or energy inside and into a lake. Physical parameters often regulate a wide range of chemical and biological processes that occur within lakes. Accurate physical measurement data are critical to the research and management of lakes and other freshwater resources. Physical sensors can vary from simple handheld devices to complex remote buoy based systems used for real-time data on lake conditions1.
What do physical sensors measure?
While many physical measurements are possible in aquatic environments, several important commonly measured physical parameters include:
Physical sensors for meteorological measurements are also commonly used; however, these are covered in the Meteorological Sensors section.
Temperature Sensors
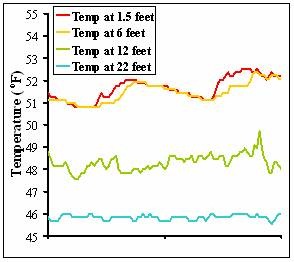
Temperature data from two days in an example lake show that surface water is much warmer and fluctuates much more than temperature deeper in the water column.
Monitoring the yearly evolution of air and water temperature and thermal stratification is a critical component in many lake management and research programs. Temperature data is one of the most commonly reported lake measurements because it is extremely important in a number of other aquatic processes and is relatively inexpensive and easy to measure. Water temperature in many lakes is measured continuously using strings of temperature sensors that span the water column. Fisheries management, hydroelectric plants, selective withdrawal dams, and numerous aquatic and sediment research efforts often depend on having water temperature data from throughout the water column.
Temperature sensors are often put close to one another near the surface of the lake, about every 1.5 feet (0.5 meter), so that high-resolution temperature data are collected. Deeper in the water column, below where water is regularly mixed, sensors are spaced out more widely, every 3-6 feet (1-2 meters) or more, because temperature changes usually occur slower and more predictably deeper in the water column.
Temperature sensors operate using a number of different techniques. Common temperature sensors utilize thermocouple, resistor, or semi-conductor technologies. Sensors often have a non-linear temperature response; therefore, a full calibration curve must be determined through the range of applicable temperatures. Sensors range in accuracy from within several degrees to within 0.1 oC or better, depending on the technology, materials, and calibration.
CDOM
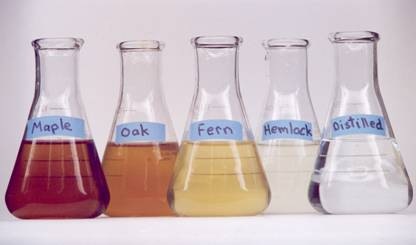
The beakers in this photo highlight how different sources of CDOM can vary widely in color. CDOM imparts a brown or yellowish hue to many lakes. (Image from Craig Williamson.)
Colored (or chromophoric) dissolved organic matter (CDOM) is a substance that gives many lakes a brownish or yellowish hue4. CDOM naturally forms from trees and other vegetation in the landscape around lakes but also is concentrated in lakes from agriculture and improper land use. CDOM is analogous to tea leaves soaking in a cup of hot water. It often regulates transparency to both visible light and damaging ultraviolet radiation in lakes, and it is a food source for the basis of aquatic food webs, providing nutrients for algae and energy for bacteria.
Typically, CDOM is measured in the water with a fluorometer. A lamp inside the sensor emits ultraviolet light onto a water sample containing CDOM. CDOM fluoresces in the same manner a black light shining on clothing produces different color light. The fluorescence is registered by a photodiode inside the sensor and outputs a measurable voltage. The voltage is proportional to the concentration of CDOM5.
Turbidity
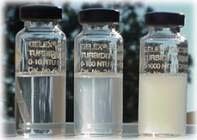
Water samples with 5, 50, and 500 NTU of turbidity highlight the effect of increasing turbidity on the cloudiness of water. High turbidity can be harmful to lake ecosystems.
Turbidity is a measure of the light scattering properties of particles in the water — in other words, the water’s cloudiness. Particles can range from dust and dirt from nearby roads to algae and materials from vegetation in the land around a lake. Because variation in particulate size, shape, and distribution affect turbidity readings, its measurement is site- and depth-specific depending on local geology, soil conditions, land use, and river inputs. High turbidity can be harmful to aquatic organisms, alter the clarity of water, and contaminate drinking water supplies.
Turbidity is caused by suspended solids (i.e. phytoplankton or sediments) that have a different refractive index than water. It is reported in nephelometric units (NTUs), which refers to the type of instrument (turbidimeter or nephelometer) used for estimating turbidity.
A way to measure turbidity is by detecting the attenuation of light as it passes through a water sample using a device called a transmissometer. Handheld turbidity sensors, also known as nephelometers, use another approach. They emit light into the water and then measure how much is scattered to the side at a 90-degree angle. The amount of scattered light is proportional to the turbidity6.
Glacial lakes are a classic and beautiful example of how turbidity affects lakes. Glacial lakes usually have extremely high turbidity because glaciers grind against rocks to release fine sediments, called glacial flour, into downstream lakes. The underlying geology and soils determine the size, shape, and distribution of particles, and this creates the many beautiful colors seen in glacial lakes.

The beautiful color of Peyto Lake in the Canadian Rockies is regulated by the turbidity of its waters due to inputs from a nearby glacier.
Transparency
Transparency is the amount of light that can pass through a medium without being reflected or absorbed. Transparency is one of the most fundamental properties of aquatic ecosystems since it regulates a number of processes that occur underwater, including photosynthesis. Transparency can be measured in many ways. One of the most accurate measurements of transparency is achieved by submerging two light sensors at different depths in the water column. Differences in light measurements between these sensors provide an estimate of transparency. Another common and simple measurement of transparency is conducted with an instrument call a Secchi disk. A Secchi disk is an all-white or black-and-white round disk that is lowered into the water until it is no longer visible. The depth at which it disappears and the depth at which it reappears is averaged to produce what is termed the Secchi Depth7.
Depth/Pressure
Water depth is an important physical measurement of lakes and other freshwater resources. For example, water depth provides managers of lakes used for water supplies critical information about water stocks and usage. Depth can be measured simply with a marker pole; however, there are a variety of sensors that can provide automated data on water depth.
In many automated applications, a pressure sensor infers water depth. The relationship between water depth (h) and water pressure (Pf) is:
Ptotal=Pa+ Pf = Pa+ (ρ*g*h)
The atmospheric pressure Pa is 100,000 N/m2, water density ρ is about 1000 kg/m3 (for freshwater), and gravity is g = 9.8 kg/m2. Using this equation, water depth — specifically, the depth of water on top of the pressure sensor — is inferred from water pressure. Sensors used in this fashion typically house a submersible pressure transducer so that pressure change is converted into an electrical current and this electrical current can be read and interpreted automatically, providing managers and scientists detailed depth information. A pressure transducer can be used in many different applications beyond lakes in groundwater wells, streams, and rivers.
Groundwater Flow
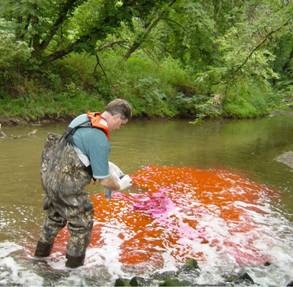
Scientists use dyes, such as rhodamine, to track the movement of water through the landscape. Here, USGS scientists release rhodamine into a river in Indiana. (Image from 9.)
The flow of water underground and into and out from lakes is important to understand in many environmental studies. For example, an oil refinery may want to know if ground water flows out from under their property into adjacent properties to establish the risk of refinery pollutants leaving their land. Lake scientists and hydrologists utilize fluorescent dye tracing to determine direction and velocity of ground water flow as well as the connection between recharge and discharge points8.
Certain dyes that are generally non-toxic, water soluble and easily detectable are used to trace ground water flow8. These dyes can be released into a waterway and traced with sensors, which are sensitive to a specific dye that is not found naturally. Sensors can be mounted on multiparameter sondes or moored buoys to trace water flow through a landscape or water body. Alternatively, a handheld sensor can be used on site to locate dye molecules, or a water sample containing suspected dye can be taken back to the laboratory to be analyzed by a spectrofluorometer.
Sources:
- Porter, John et al. (2005) Wireless Sensor Networks for Ecology. Bioscience 55 561-572.
- Simpson, J.B.et al. (1991) Temperature In Instrumentation and Measurement for Environmental Sciences. American Society of Agricultural Engineers 601–617.
- Wang, S. et al. (2003) Temperature Measurement. Encyclopedia of Agricultural, Food, and Biological Engineering 987-993.
- Lopez, C. (2008, February 15) Mysterious Compound Seen As Key to Ocean Life. Live Science, Retrieved March 16, 2010, from http://www.livescience.com/environment/080215-bts-ocean-productivity.html
- Seapoint Sensors Inc. Seapoint Ultraviolet Fluorometer. Retrieved March 16, 2010, from http://www.seapoint.com/suvf.htm
- Turbidity. (n.d.) From Wikipedia. Retrieved March 17, 2010, from http://en.wikipedia.org/wiki/Turbidity
- Michigan Lake & Streams Association. The Secchi Disk – What is it? Retrieved March 17, 2010, from http://www.mlswa.org/secchi.htm
- Crawford Hydrology Laboratory (2010) Retrieved March 18, 2010, from http://www.dyetracing.com/
- USGS. Distribution and Transport of Emerging Contaminants in Streams Photo Gallery. 2010. Retrieved online at: http://toxics.usgs.gov/photo_gallery/instreams.html


