New Algorithm Improves Great Lakes Ice Mapping
0
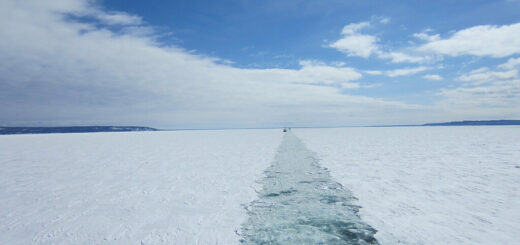
The U.S. Coast Guard Cutter Mackinaw (left) breaks ice in tandem with Cutter Neah Bay on Lake St. Clair during Operation Coal Shovel, January 2013. (Credit: Ensign Guillermo Colom)
Mapping ice cover on the Great Lakes is difficult, often held back by limitations of optical sensors on satellites. The instruments experience issues penetrating darkness and cloud cover, can’t determine ice type by themselves and their images rely on human analysts for interpretation.
To make up for those limitations, a research crew took measurements of Great Lakes ice, focusing largely on Lake Superior, beginning during the winter of 1997. Their goal was to develop algorithms that could accurately map ice type using satellite Synthetic Aperture Radar (SAR) data.
“In the past, really there wasn’t an algorithm to classify ice types. There were algorithms, methods to map ice concentration,” said George Leshkevich, physical scientist at the National Oceanic and Atmospheric Administration (NOAA). “Those methods are still being used today.”
Knowing ice concentration is useful to the U.S. Coast Guard, National Weather Service and fisheries managers. “The lack of ice cover can affect water levels. With no ice cover, there will be greater evaporation and lake-effect snow,” said Leshkevich. “As far as fisheries are concerned, a number of species require ice cover over spawning beds. If it’s not there, it can affect fish recruitment for the next season.”
But without a way to map ice type, there was a clear gap in knowledge of Great Lakes ice. Leshkevich and collaborator Son Nghiem, a senior research scientist at NASA’s Jet Propulsion Laboratory, began by discerning backscatter differences among ice types. They used a C-band radar mounted on the deck of the U.S. Coast Guard Cutter Mackinaw. The backscatter depends on the way the ice is layered, Leshkevich says, as well as its thickness and roughness.
The researchers measured the backscatter of brash ice, which is formed by floating pieces of ice of various size pushed together by wind and waves. This ice type can be hazardous to winter navigation and ice breaking operations as it can reach a thickness of about 9 meters. They also encountered pancake ice, which has been rounded by collisions with other pieces of ice.

Pancake ice on Lake Michigan, Feb. 18, 2000. (Credit: NOAA Great Lakes Environmental Research Laboratory)
Black ice, which Leshkevich describes as clear ice with few bubbles, is usually dusted by a layer of snow. The snow on top turns to slush while water below forces its way upward when the ice cracks. This creates another type of ice. “I’ve seen ice where there’s several layers of this stuff,” said Leshkevich. “I call it stratified ice, like a layer cake. And that’ll have a different scattering pattern.”
The C-band radar on the deck of the icebreaker sent and received microwaves horizontally or vertically. The backscatter of each ice type varied by the incidence angle of the radar transmission wave making contact.
“In the algorithm, it’s important to classify ice by the incidence angle. At different look angles, the radar scattering varies,” said Leshkevich. “Each type of ice has a characteristic radar backscatter.”
“Owing to wind speed and direction over water, water can be misclassified as ice,” said Leshkevich. Using the library of backscatter signatures from different ice types, Leshkevich and Nghiem developed methods to first identify ice and water. Once that was done, the library of ice backscatter signatures could be compared to backscatter patterns in the SAR imagery and applied within the algorithm to classify ice types remotely.

A color-coded image of major ice types on Lake Superior, made from a RADARSAT1 radar backscatter image using a new NASA and NOAA-developed technique. (Credit: NOAA Great Lakes Environmental Research Laboratory and NASA/JPL-Caltech)
“What we’re trying to do is automate the method to not only define ice and water but to define ice types,” said Leshkevich.
But the new algorithm accounted for the variables well, and officials at NASA say the technique is so accurate that it can identify a narrow channel of open water cut through ice by a ship, even at night. Radar instruments on Canadian and European satellites collect data that go into the formula.
“In the dark, it’s difficult to read a map that’s right in front of you,” said Son Nghiem. “Yet we now have a way to use satellite radars almost 500 miles out in space to see through clouds and darkness and map ice across the Great Lakes.”


