


Research Summary: Lake Ontario Phosphorus Loading
0
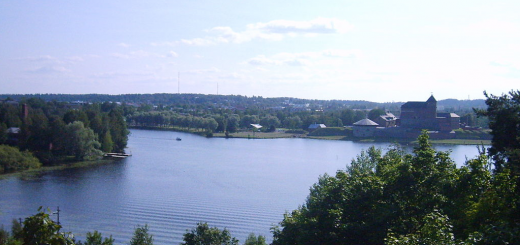
Lake Ontario, visible from the campus of Appleby College. (Credit: Cecilia Pang via Wikimedia Commons)
Tributary phosphorus (P) loading was estimated for 145 Canadian and American streams entering Lake Ontario and was compared with historical P loads of the Niagara River. The 145 Lake Ontario tributaries contributed 2606 mT/year of P, with the U.S. tributaries contributing 1411 mT/year and the Canadian tributaries contributing 1195 mT/year. In New York, the largest tributary sources of total phosphorus (TP) were from the Genesee River (417 mT/year), followed by the Oswego River (336 mT/year) and the Black River (135 mT/year). In Ontario, the largest tributary sources of TP were from the Trent River (200 mT/year), the Humber River (93.0 mT/year), and the Welland Canal (80.8 mT/year). Phosphorus loading from both Canadian and American wastewater treatment plants was 781 mT in 2008. The total P load of tributaries (2606 mT/year) to Lake Ontario was 234% higher than that of wastewater treatment plants and was 67.5% of the 1982 Niagara River P load and 50.3 to 70.6% of the 1999 and 2004 Niagara River P loads. While the P load from the Niagara River connecting channel is important to the overall trophic status of the offshore of Lake Ontario, the impact of tributaries on water chemistry and ecology of the nearshore and embayments of Lake Ontario is potentially great and is being increasingly recognized as a driver of nearshore conditions.
Tributary loads
The total tributary TP load for New York State was 1411 mT/year (Table 1). The largest tributary sources of TP were from the Genesee River at 417 mT/year, followed by the Oswego River at 336 mT/year, and the Black River at 135 mT/year. Unmeasured tributaries were estimated to generate 352 mT/year. The Ontario watershed total TP tributary load was 1195 mT/year (Table 2). The largest tributary sources of TP were from the Trent River at 200 mT/year, the Humber River at 93.0 mT/year, and the Welland Canal at 80.8 mT/year. Unmeasured tributaries were estimated to generate 263 mT/year. Estimates of P loads for the American tributaries may have a greater, but unknown, level of uncertainty than the Canadian estimates as some of the U.S. flow data are not based on continuous discharge measurements and in some cases only based on monthly P measurements.

Table 1. Annual tributary total phosphorus (TP) loading to Lake Ontario from New York watersheds. List of tributaries is from the Niagara River east along the south shore. All units are in metric tonnes/year (mT/year). American data was collected over a 20-year period from 1988 to 2008.
Niagara River loads
Tributary loads estimated here are compared with previous estimates of Niagara River loads from 1982 (Neilson et al., 1995) and 1999–2004 (Environment Canada, 2009). Niagara River P loads for 2008 were not available.

Table 2. Annual tributary loadings of total phosphorus (TP) to Lake Ontario from Ontario watersheds. List of tributaries is from the Niagara River west and then east along the north shore. Loadings [metric tonnes/year (mT/year)] are estimates for 2008. Ck.=Creek.
Direct wastewater sewage treatment plant loads
The average 2008 and 2009 direct annual discharge of TP from the 11 New York State WWTPs are shown in Table 3. The total annual New York TP load from WWTPs was 137 mT, with the largest contribution coming from the Van Lare plant at 108 mT/year, followed by the Northwest Quadrant (17.3 mT/year) and the Walter W. Bradley—Webster plants (6.9 mT/year).

Table 3. Annual direct discharge of total phosphorus (TP) to Lake Ontario from New York wastewater treatment plants. Values are the average for 2008 and 2009. All units are in metric tonnes/year (mT/year). Data are from the Monroe County Health Department and the New York State Department of Environmental Conservation.
The 2008 direct annual discharge of TP from the 38 Ontario WWTPs are shown in Table 4. The total annual Ontario TP load was 644 mT with the top five loads from Ashbridges Bay (154 mT/year), Duffins (90.8 mT/year), Humber (84.6 mT/year), Hamilton–Woodward (73.1 mT/year), and Lakeview South Peel (62.2 mT/year)WWTPs.
Direct industrial loads
We have not presented the individual industry loads here. The U.S. load of TP for 2008 was 0.3 mT; the Canadian load was 16.3 mT.

Table 4. Annual direct discharge of total phosphorus (TP) from Ontario wastewater treatment plants to Lake Ontario. Values are for 2008 from the Ontario Ministry of Environment MISA program. All units are in metric tonnes/year (mT/year).
Acknowledgements
We thank two anonymous reviewers and T. Howell for their time and considerable effort to improve this manuscript. T. Lewis also provided helpful constructive comments. Data for 2008 and 2009 on direct discharge of phosphorus in effluent from nine American WWTPs were provided from the New York State Department of Environmental Conservation (D. Hayes). The Monroe County Environmental Lab kindly provided unpublished data from 2008 and 2009 for the Northwest Quadrant and the Van Lare WWTPs (S. Bland). Ontario WWTP data came from the Ontario Ministry of Environment MISA program office.
Full study and references published September 2012 in the Journal of Great Lakes Research (Volume 38, Supplement 4, pages 2 – 9)
Selected References
- APHA, 1999. Standard Methods for the Examination of Waste and Wastewater. American Public Health Association, New York.
- Cadmus Group, 2007a. Total maximum daily load (TMDL) for phosphorus in Little Sodus Bay, Cayuga County, New York. Prepared for the U.S. Environmental Protection Agency, Region 2, 290 Broadway, NY 10007.
- Cadmus Group, 2007b. Total maximum daily load (TMDL) for phosphorus in Blind Sodus Bay, Wayne County, New York. Prepared for the U.S. Environmental Protection Agency, Region 2, 290 Broadway, NY 10007.
- Chapra, S.C., Dove, A., Dolan, D.M., 2012. Analysis of interlake mass loading trends of major ions and nutrients via Great Lakes connecting channels. Abstract. IAGLR’s 55th Annual Conference on Great Lakes Research. May 13–17, 2012.
- Chow, J., Abbey, A.I., Khan, Z., Dermicheva, S., Jennings, W., Wilson, P., 2010. 2009 performance report: general chemistry and microbiology analyses section. Ontario Ministry of the Environment Report. Queen’s Printer for Ontario, Ontario, Canada.
- Depew, D.C., Stevens, A.W., Smith, R.E.H., Hecky, R.E., 2009. Detection and characterization of benthic filamentous algal stands (Cladophora sp.) on rocky substrata using a high-frequency echosounder. Limnol. Oceanogr. Methods 7, 693–705.
- Dove, A., 2009. Long-term trends in major ions and nutrients in Lake Ontario. Aquat. Ecosyst. Health Manag. 12 (3), 281–295.
- Environment Canada, 2009. Niagara River upstream/downstream monitoring program report: 2001–2002 to 2004–2005. A Joint Publication of New York State Department of Environmental Conservation. Environment Canada, U.S. Environmental Protection Agency, and Ontario Ministry of the Environment.
- Great Lakes Water Quality Board, 1989. Report on Great Lakes Water Quality. International Joint Commission, Windsor, Ontario.
- Great Lakes Water Quality Board, 1993. Report on Great Lakes Water Quality. International Joint Commission, Windsor, Ontario.
Lake Ontario Phosphorus