Research Summary: Risk-Based Screening Of Selected Contaminants In The Great Lakes Basin
0aIntrinsik Environmental Sciences Inc., 6605 Hurontario Street, Suite 500, Mississauga ONL5T 0A3, Canada
bOntario Ministry of the Environment and Climate Change, 40 St. Clair Ave West, 7th floor, Toronto, ON M4V 1M2, Canada
Introduction
The Great Lakes Basin is one of the most biologically diverse regions in Canada and the United States (US). The lakes (Superior, Michigan, Huron, Erie and Ontario) support thousands of wetlands and diverse plants, fish and wildlife. The Basin is surrounded by lands of the States of Illinois, Indiana, Michigan, Minnesota, New York, Ohio, Pennsylvania and Wisconsin in the US and the Province of Ontario in Canada.
Targeted actions, by both the Canadian and US governments over the last two decades to control industrial, municipal and agricultural sources of chemicals in the Basin, have resulted in significant improvements in water quality. However, the Basin continues to be affected by both direct and indirect sources of chemicals that can enter the environment every day due to residential, commercial and industrial activities as well as by the continued presence of legacy chemicals. More recently, with the enhancement of analytical techniques, scientists have begun to identify new chemical threats to the Basin, identified as ‘contaminants of emerging concern’ based on their unknown human health and/or environmental risks. These contaminants may be previously unknown (based on new synthesis), unrecognized (never monitored for in the Basin) or unregulated (no standards or guidelines). Under the newly-ratified Great Lakes Water Quality Agreement (2012), Canada and the US have a mandate to prioritize chemicals, known as “chemicals of mutual concern”, for bi-national cooperative action. Identification of emerging chemicals may help to inform priority setting and selection of chemicals of mutual concern.
Different methods and approaches have been used by governments and research organizations to identify potential priority chemicals in surface water. In 2009, Muir et al. completed the “Identification of New, Possible Persistent, Bioaccumulative and Toxic (PB&T) Chemicals in the Great Lakes Region” by screening chemicals in commerce. The approach was to combine the Canadian Domestic Substances List (DSL) with the US high production volume (HPV) chemicals on the Toxic Substances Control Act (TSCA). To reduce the list of 429 compounds to a manageable size, the authors selected 10 priority chemicals from 5 chemical groupings (brominated, chlorinated, fluoridated, nonhalogenated or silicone related). Although quantitative structure activity relationships (QSARs) were used to assess aquatic toxicity and cancer potential, they were not used to prioritize chemicals.
In 2011, the Water Environment Research Foundation funded a project to develop a diagnostic tool to evaluate and prioritize trace organic compounds (TOrCs) according to three approaches: 1) risk, 2) chemical PB&T, and 3) a hybrid approach based on risk, persistence, and bioaccumulation potential (Diamond et al., 2011). The approach was similar to that of Muir et al. (2009) with a focus on persistence and bioaccumulation of the individual chemicals. Unlike Muir et al., the authors considered only unregulated chemicals (517), which were then grouped into several classes: pharmaceuticals and personal care products (PPCPs), natural and synthetic hormones, surfactants, deodorizers/fragrances, industrial chemicals, current use pesticides, polycyclic aromatic hydrocarbons (PAHs), flame retardants and plasticizers. Chemicals in all categories were identified as high priority using at least one of the three approaches, although more pesticides were identified than any other category of chemical, and fewer personal care products, PAHs and flame retardants were identified than the other categories. This diagnostic tool used predicted chronic toxicity thresholds using a QSAR model instead of using empirical toxicity data.
More recently, Blair et al. (2013) completed a review and prioritization of PPCPs that are of environmental concern in Lake Michigan. The authors compared measured concentrations of selected chemicals with reported predicted no-effect concentrations (PNECs) that were reported using the review paper from Verlicchi et al. (2012) and ECOSAR v.1.11 from the US EPA (USEPA, 2012). The authors determined that 14 PPCPs were of ecological concern to this Great Lake.
In 2009, the International Joint Commission (IJC) compiled a decade’s worth of environmental data to understand chemical presence in the Great Lakes Basin (Klecka et al., 2009). Data for approximately 320 chemicals (pesticides, pharmaceuticals, organic wastewater constituents, nonylphenol ethoxylates, perfluorinated surfactants, chlorinated paraffins, synthetic musks and flame retardants) measured in water and sediment were compiled and summarized in the report. These data were then compared to Canadian, American and European guidelines. However, many of the chemicals did not have guidelines and hence the significance of the measured concentrations could not be determined.
Detection of a chemical in a particular environmental matrix does not necessarily mean that it is of concern or may cause harm. Thus, the objective of the following risk-based screening exercise was to identify chemicals detected in the Great Lakes Basin that may be of concern to aquatic life through the development of benchmarks based on available toxicity information. We present the approach, selected or developed benchmarks and results of our screening exercise and compare the results of the chemicals that had hazard quotients (HQ) suggesting possible toxic effects (HQ > 1) to those identified in other studies.
Methods
The significance of the chemicals measured in water and sediment from both Canadian and American sample sites of the Great Lakes Basin was evaluated by comparing measured concentrations to aquatic toxicity guidelines and screening benchmarks. As an initial screening, the maximum measured concentration was used and compared to environmental guidelines from a number of sources. When guidelines were not available, a literature search was conducted to develop a screening benchmark. To be consistent with current guidelines, the screening benchmarks were developed based on standard toxicity endpoints of survival, growth and reproduction.
Monitoring information
Monitoring data were obtained from the IJC report (Klecka et al., 2009), which reported concentrations of approximately 320 chemicals in water and sediment (Table 1). For this study, 245 chemicals were selected from the IJC list, based on preliminary screening and sorting to remove duplicates (e.g., synonyms of the same substance) and classification of some chemicals into groups. For some of the chemicals selected (pharmaceuticals and polybrominated diphenyl ethers), additional monitoring data provided by Ontario Ministry of the Environment were used to supplement the IJC data (personal communication, S. Kleywegt of Ontario Ministry of the Environment and Climate Change, Toronto, ON).

Table 1. (Credit: Hull, et al.)
Environmental Guidelines
Environmental guidelines were compiled from a number of sources. The sources were chosen based on their relevance to the Great Lakes and jurisdiction (Canadian/American), and date of publication; others were chosen based on having established criteria for the particular substance. The sources included: Canadian Water or Sediment Quality Guidelines (CCME, 2010); Ontario Provincial Water Quality Objectives and Sediment Guidelines (MOEE (Ministry of Environment and Energy), 1994a, MOEE (Ministry of Environment and Energy), 1994b and MOE (Ministry of the Environment), 2008); Environment Canada Ideal Performance Standards for pesticides (Sabo et al., 2008 and Stantec Consulting Limited, 2008); Environment Canada and Health Canada Screening Assessment Probable No Effect Concentrations (PNEC) (EC/HC (Environment Canada/Health Canada), 2008, EC/HC (Environment Canada/Health Canada), 2009a and EC/HC (Environment Canada/Health Canada), 2009b); Environment Canada Estimated No-effect Values (ENEVs) (EC (Environment Canada), 2006 and EC (Environment Canada), 2008); European Union Environmental Quality Standards (EU (European Union), 2005a and EU (European Union), 2005b); European Union Risk Assessment reports (EU (European Union), 2005c, EU (European Union), 2005d, EU (European Union), 2008a, EU (European Union), 2008b, EU (European Union), 2008c, EU (European Union), 2008d, EU (European Union), 2008e and EU (European Union), 2008f); Australia and New Zealand Environment and Conservation Council Water Quality Guidelines (ANZECC, 2000); Oak Ridge National Laboratory Screening Benchmarks for water (Suter and Tsao, 1996) and sediment (Jones et al., 1997); Office of Pesticide Programs benchmarks (US EPA OPP (United States Environmental Protection Agency Office of Pesticide Programs), 2007a, US EPA OPP (United States Environmental Protection Agency Office of Pesticide Programs), 2007b, US EPA OPP (United States Environmental Protection Agency Office of Pesticide Programs), 2007c, US EPA OPP (United States Environmental Protection Agency Office of Pesticide Programs), 2007d and US EPA (United States Environmental Protection Agency), 2011); Dutch NC (negligible concentration) and MPC (maximum permissible concentration) values from Crommentuijn et al. (1997) and United Kingdom Environmental Quality Standards (UK, 2007). Electronic supplemental Material (ESM) Table S1 gives the guidelines which were used for each substance in water and while ESM Table S2 gives the guidelines for sediment.
Benchmark development
Aquatic toxicity benchmarks were needed to evaluate the significance of the measured environmental concentrations for chemicals without guidelines. For those chemicals without environmental guidelines, a literature search was conducted and screening aquatic toxicity benchmarks were developed. Benchmarks were developed generally following the Canadian Council of Ministers of the Environment (CCME) water quality guideline development process (CCME, 2007). For this exercise, both a no-observed-effect concentration (NOEC) and the lowest-observed-effect concentration (LOEC) benchmark were developed, where data were available. The LOEC benchmark was intended as a concentration that may cause an adverse effect and the NOEC benchmark was intended as a concentration estimated not to cause an adverse effect. Most benchmarks were developed based on available toxicity information up to and including 2012 (see ESM Tables S1 and S2 for complete lists of benchmarks).
Existing databases (e.g., ECOTOX, 2011 and Wiki Pharma, 2011) were consulted before the literature search was conducted. Scientific literature collected for each substance was reviewed and the appropriate effect data was collated for use in benchmark development. The quality of the studies was not investigated (e.g., static vs. flow-through conditions, nominal vs. measured concentrations, appropriate statistical analysis). However, when information on study quality was available, it was considered in the benchmark development process. In addition, the original paper was reviewed for each study that formed the basis of a benchmark to ensure that data and study details (e.g., concentration, units, acute vs. chronic) were correct. Consistent with the CCME water quality guideline development process (CCME, 2007), benchmarks were based on survival, growth and reproduction endpoints. Non-traditional endpoints (e.g., behavior) were considered where there was a potential link to whole organism effects (e.g., survival, growth or reproduction) based on professional judgment and comments made by authors of the studies reviewed. For example, a decrease in predator avoidance or swimming ability was considered to have a potential link to decreased survival. The lowest chronic NOEC or Effect Concentration/Lethal Concentration (EC/LC) ≤ 10 value was used to derive the NOEC benchmark, and the lowest chronic LOEC or EC/LC > 10 value was used to derive the LOEC benchmark. The general approach used to identify or develop the benchmarks is illustrated in Fig. 1. Two benchmarks were developed for data rich chemicals. In data poor instances, only one benchmark could be developed (Table 2). Also, if only acute data were available, an acute benchmark was developed; these were generally based on LC50 or EC50 data.
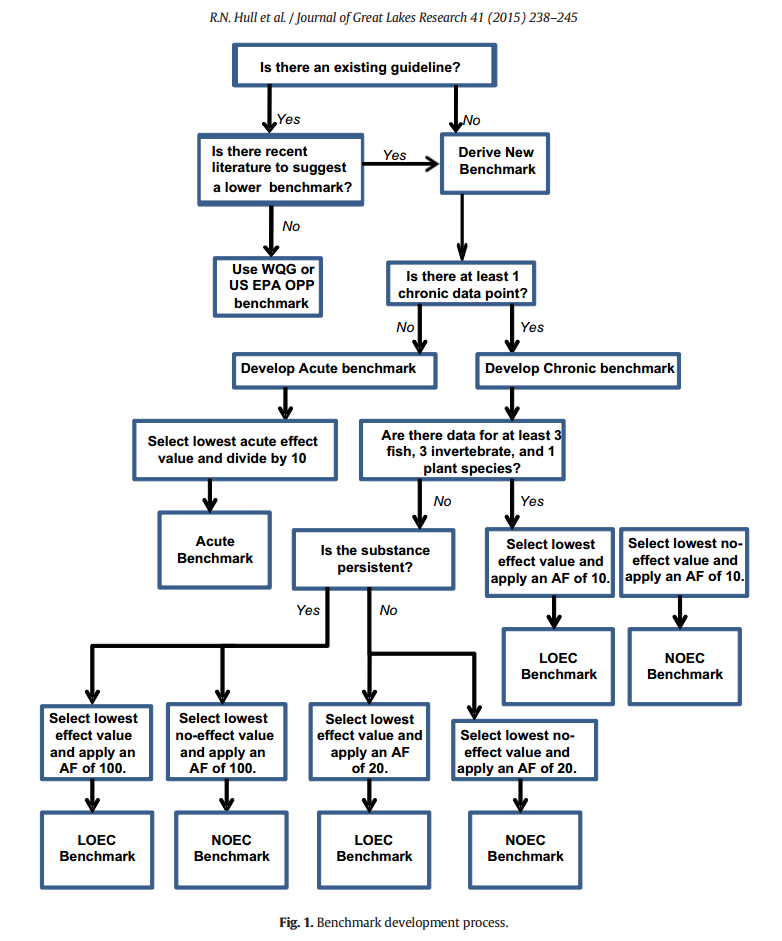
Figure 1. Benchmark development process. (Credit: Hull, et al.)
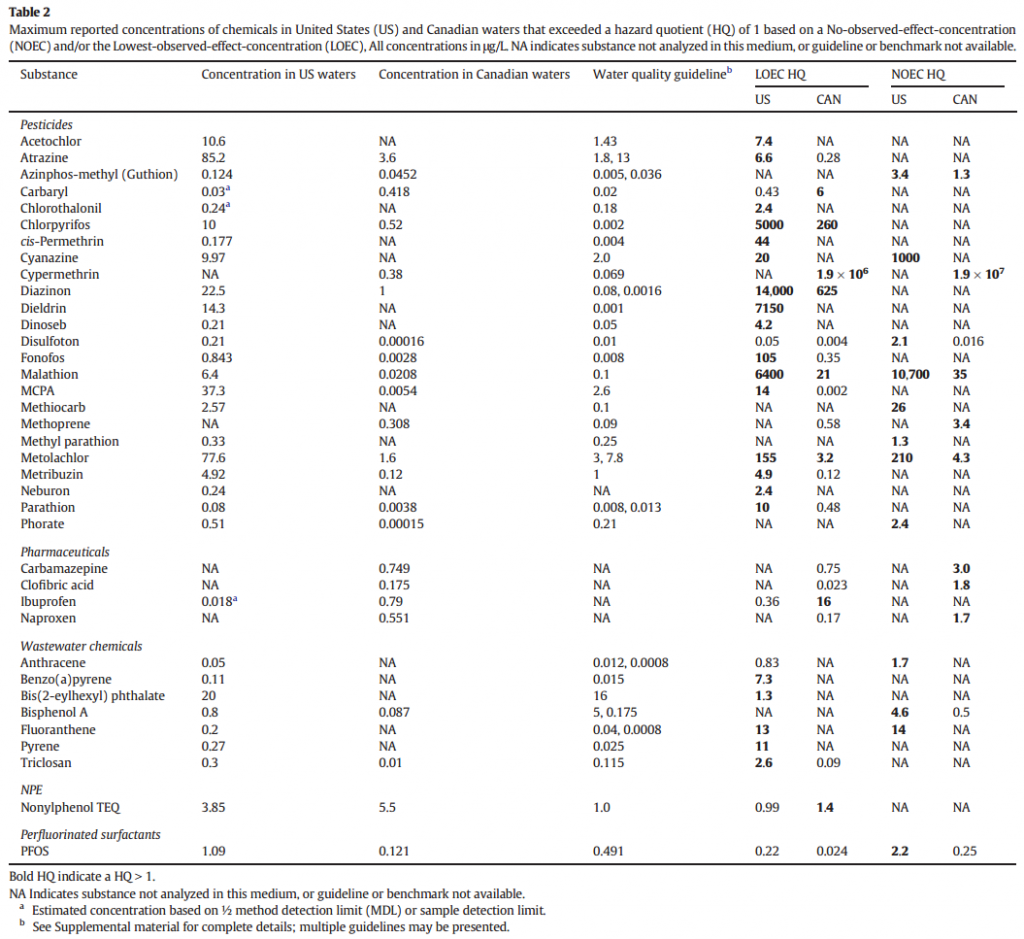
Table 2. (Credit: Hull, et al.)
To derive a benchmark, the critical toxicity value was divided by an application factor (AF). Application or safety factors (hereafter referred to as application factors) were applied to account for uncertainties in the data (e.g., extrapolation between species), and have been used in both human health and ecological risk assessments and guideline development (Solomon et al., 2007). Similar to the approach used to derive water quality guidelines (CCME, 2007), the AF differed based on the available dataset. An AF of 10 was applied to the critical study (i.e., the lowest acceptable and appropriate toxicity endpoint) to derive the benchmark when the available data generally met the species requirements for a CCME Type B1 guideline (CCME, 2007): three species of freshwater fish, three species of freshwater invertebrate, and one species of freshwater plant. The requirements for particular types of species (e.g., the need for a salmonid species to be included) were not considered because few of the chemicals had datasets that met the rigorous requirements of a CCME water quality guideline. Consistent with the approach to derive a CCME Type B2 guideline (CCME, 2007), an AF of 20 or 100 was applied to the critical study to derive the benchmark when the available data did not meet the requirements for a Type B1 guideline. The AF of 20 was used if the substance was not persistent (i.e., the half-life in water was less than 8 weeks; CCME, 2007), and the AF of 100 was used if the substance was persistent (CCME, 2007). In each case, the AF accounted for differences in species (intra and interspecies), exposure conditions (laboratory versus field, varying environmental conditions), paucity of toxicological data, etc. (CCME, 2007).
The benchmark protection goal (NOEC benchmark) is typically the protection of 100% of exposed species; however, significant uncertainty exists given the often limited datasets used and the use of application factors. The benchmarks derived in this study have been used as an initial screening tool, to identify potential issues in the monitoring data. Therefore, benchmarks were only derived for chemicals and media for which monitoring data were available (e.g., if a substance was monitored only in water, no benchmark for the substance in sediment was derived).
Grouping of chemicals
Subsets of the chemicals (congeners) were grouped based on their chemical classifications. These included perfluorinated compounds, chlorinated paraffins, nonylphenol ethoxylates (NPE) and polybrominated diphenyl ethers (PBDEs).
All of the perfluorinated surfactants that are sulfonates were assessed by Perfluorooctane Sulfonic Acid (PFOS) and all those that are carboxylic acids were assessed using Perfluorooctanoic Acid (PFOA). The short-chain chlorinated paraffins (C10 to C13) were assessed using “Total SCCP” (Total Short-Chain Chlorinated Paraffins), and the medium-chain chlorinated paraffins (C14 to C17) were assessed using “Total MCCP” (Total Medium-Chain Chlorinated Paraffins). Nonylphenol and its ethoxylates were assessed using toxic equivalency factors (TEFs) related to nonylphenol (CCME (Canadian Council of Ministers of the Environment), 2002a and CCME (Canadian Council of Ministers of the Environment), 2002b). The PBDEs were grouped according to the number of bromine atoms (i.e., all the triBDEs considered together, all the tetraBDEs considered together, etc. for these plus the pentaBDEs, hexaBDEs, heptaBDEs and decaBDE). The number of congeners within a group varies. Deca-BDE has only one congener, also known as BDE-209, while the pentaBDEs include 46 individual congeners (BDE-082 to BDE-127) (Health Canada, 2006).
Hazard quotient derivation
Hazard quotients (HQs) were calculated as the ratio of the maximum reported concentration of a contaminant measured in the Great Lakes Basin and either the corresponding available environmental guideline or a benchmark derived from the available toxicity literature. For HQs based on an older existing guideline, a review was carried out to determine whether a more stringent benchmark should be considered. If so, the new benchmark was adopted/set and used for the HQ calculation.
![]()
Results
Water
Of the 245 chemicals identified, 216 had water data and were selected for the screening. Of these, 102 could be screened out (below existing benchmarks) and 114 chemicals were identified for follow up including 33 chemicals that exceeded an existing benchmark and 81 chemicals that did not have a benchmark (Table 1). However, HQs could not be calculated for 25 chemicals due to limitations in the analytical and/or toxicological data (Table 1). Most of these chemicals were pharmaceuticals. For many of these emerging contaminants, there are no analytical standards or licensed methods. The analytical detection limits are sometimes in the parts per billion range, and based on potential toxicity of some chemicals, detection limits may be required in the parts per trillion range or lower, for both water and sediments. Additionally, many pharmaceuticals were anti-microbial agents and only limited data were available on their effects on natural microbial communities (e.g., Brosche and Backhaus, 2010). There were endocrine disruption data available for several organic wastewater constituents; however, to maintain consistency with the water quality guideline development process, these data were not included in the benchmark development. In future, should toxicity data with endocrine disruption endpoints be directly linked to a whole organism effect, then these endpoints and data could be considered in the risk-based screening.
Of the 89 remaining chemicals, HQs were calculated based on an LOEC and/or NOEC benchmark. Of these, 52 chemicals had HQs below 1. The remaining 37 chemicals had at least one HQ above 1 and are summarized in Table 2.
From the US data, there were 29 chemicals with HQs greater than 1 based on a NOEC and/or LOEC (Table 2). Concentrations of azinphos-methyl, disulfoton, methiocarb, methyl parathion, phorate, anthracene, bisphenol A and PFOS exceeded NOEC benchmarks but not LOEC benchmarks. Chemicals that exceeded LOEC benchmarks were: acetochlor, atrazine, chlorothalonil, chlorpyrifos, cis-permethrin, cyanazine, diazinon, dieldrin, dinoseb, fonofos, malathion, (4-chloro-2-methylphenoxy) acetic acid (MCPA), metolachlor, metribuzin, neburon, parathion, benzo(a)pyrene, bis(2-ethylhexyl) phthalate, fluoranthene, pyrene and triclosan (Table 2).
From the Canadian data, there were 13 chemicals with HQs greater than 1 based on a NOEC and/or LOEC. Concentrations of azinphos-methyl, carbamazepine, clofibric acid, methoprene and naproxen exceeded NOEC benchmarks but not LOEC benchmarks. Concentrations of carbaryl, chlorpyrifos, cypermethrin, diazinon, ibuprofen, malathion, metolachlor and nonylphenol-TEQ exceeded LOEC benchmarks (Table 2).
There were only 5 common chemicals with HQs greater than 1 based on data for US and Canadian waters. These chemicals were all pesticides (azinphos-methyl, chlorpyrifos, diazinon, malathion and metolachlor).
Concentrations of 2,3,6-trichlorobenzoic acid (2,3,6-TBA), 2,4,5-trichlorophenoxy propionic acid (2,4,5-TP; Fenoprop), indomethacin, acetophenone, 2,6-di-tert-butyl-phenol and the synthetic musks were compared only to acute toxicity benchmarks, as chronic toxicity data were not available for benchmark development. All maximum concentrations were at least 500 times below the acute benchmark suggesting a low likelihood of adverse effects to aquatic life from exposure to these chemicals, based on traditional aquatic toxicity endpoints.
Sediment
Out of the 245 chemicals identified for this study from the IJC data (Klecka et al., 2009), 64 had data for sediment. Of these, 45 were identified for follow up, including 10 that exceeded a benchmark and 35 that had no benchmark. However, HQs could not be calculated for 34 chemicals due to limitations in the analytical and/or toxicological data (Table 3). Most of these were pharmaceuticals and chemicals detected in municipal wastewater effluent.
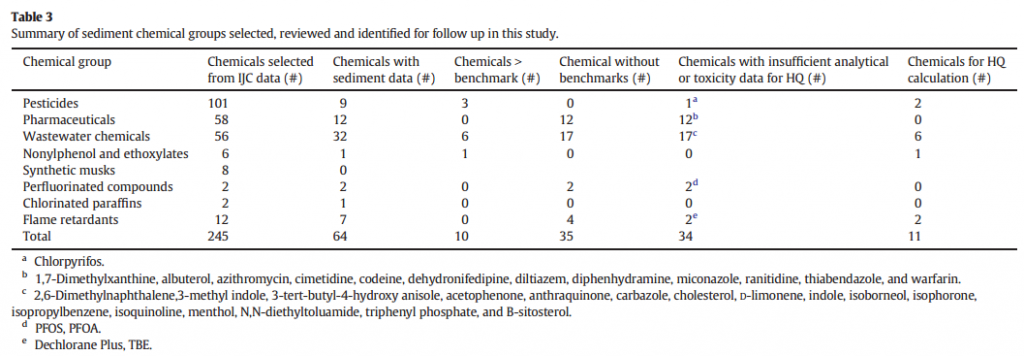
Table 3. (Credit: Hull, et al.)
For the 11 remaining chemicals, HQs were calculated based on an LOEC and/or NOEC benchmark. Of these, 2 chemicals had HQs below 1. The remaining 9 chemicals had at least one HQ above 1 (Table 4).
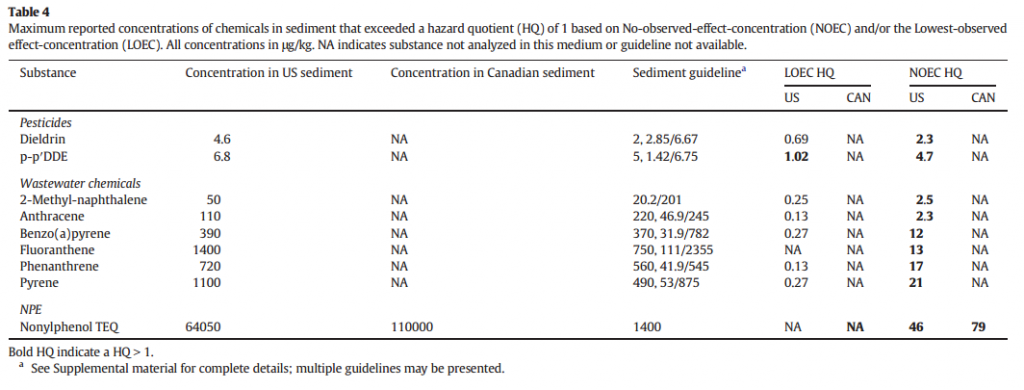
Table 4. (Credit: Hull, et al.)
From the US data, the concentrations of dieldrin, p–p′-DDE, 2-methylnaphthalene, anthracene, benzo(a)pyrene, fluoranthene, phenanthrene, pyrene and nonylphenol-TEQ exceeded NOEC benchmarks. The maximum concentration of p-p′-DDE also exceeded the LOEC benchmark.
From the Canadian data, the only HQ that could be calculated was for NPE, which exceeded the NOEC benchmark.
Full study, including Discussion, Conclusions and Acknowledgements published under Creative Commons License 3.0 in the Journal of Great Lakes Research.
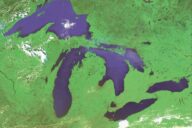
Featured Image: Great Lakes as seen from space. (Credit: NASA)


